
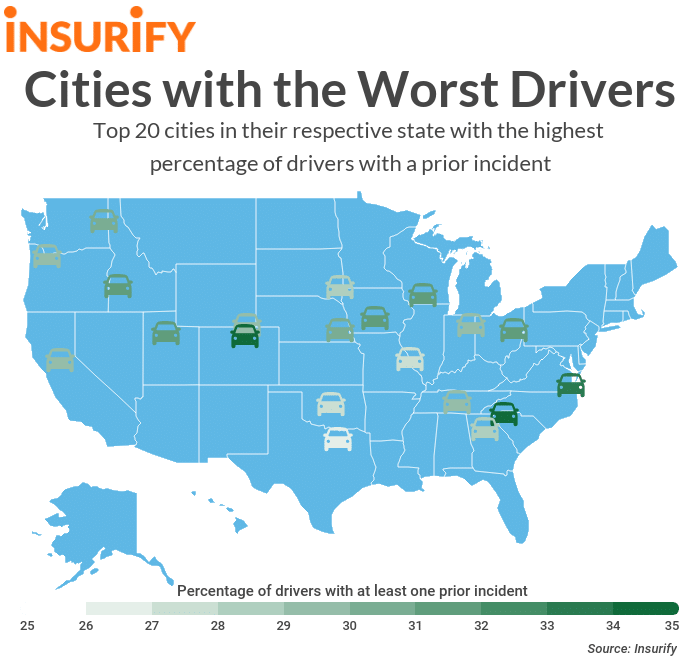
These Are the Cities With the Worst Drivers
We can’t all be the best.
Ask anyone about their driving abilities and most people will likely respond, at worst, with “not bad.” In fact, according to the evidence, the majority of people would actually fancy themselves above average. A study done in 2014 by a pair of New York University researchers found that the average driver would rate themselves in the 70th percentile for driving ability.
The reality, though, is that not everyone can have 70th percentile driving ability. There are a lot of people with less than stellar vehicle records and questionable driving habits. After all, remembering every driving law and good practice is difficult, and with the advent of smartphones and other technology accessible from the inside of a car, many drivers don’t have their full attention on the road at all times. It is this inattention and forgetfulness, along with the occasional willful recklessness that leads to speeding or street racing, which leads to driving incidents of all kinds, from tickets to accidents.
Bad driving habits are a problem everywhere in the United States, but there are municipalities in which poor driving is a particularly noticeable problem. To take a closer look at driving behavior around the country, the data science team at Insurify decided to find out which cities are home to the most incidents in 2019.
Insights
- National averages. In total, 22.3 percent of drivers across the country have a prior driving incident on their record. The average number of driving-related fatalities per 100,000 people was 11.4.
- Smaller cities dominate the list. When it comes to driving violations, it seems that smaller communities are king. Seven of the 20 cities on the list had a population of under 100,000, and none were one of the United States’ 50 most populous metropolitan areas. In fact, the largest city on the list—Lincoln, which had a population of 287,401—is just the 72nd most populous city in the country.
- A problem everywhere…except the Northeast? As most frustrated commuters might attest, poor driving is indiscriminately observed across the country – but apparently underrepresented in the Northeast. None of the 20 cities on the list were from Northeast states. Seven were from the South, seven others were from the West and the remaining six of the top 20 were Midwest states.
Methodology
To determine which cities are home to the worst drivers, researchers at Insurify, an auto insurance quotes comparison website, did some research using their database of over 1.6 million car insurance applications. The number of drivers with an incident in the past seven years in each city was analyzed against the total number of drivers in those cities to determine the share of motorists with a prior incident. The city with the highest proportion in each state was chosen, and the top 20 are listed below. Data on the population of each city was taken from estimates obtained by the U.S. Census in the year 2018. Numbers on the share of driving-related fatalities per 100,000 people were obtained from 2017 information gathered by the Insurance Institute of Highway Safety (IIHS).

20. Frisco, Texas
- Percentage of drivers with a prior incident: 26.33%
- Population: 188,170
- Driving-related fatalities per 100,000 people (state-wide): 13.1
19. Saint Charles, Missouri
- Percentage of drivers with a prior incident: 27.07%
- Population: 70,764
- Driving-related fatalities per 100,000 people (state-wide): 15.2
18. Edmond, Oklahoma
- Percentage of drivers with a prior incident: 27.35%
- Population: 93,127
- Driving-related fatalities per 100,000 people (state-wide): 16.7
17. Loganville, Georgia
- Percentage of drivers with a prior incident: 27.83%
- Population: 12,532
- Driving-related fatalities per 100,000 people (state-wide): 14.8
16. Sioux Falls, South Dakota
- Percentage of drivers with a prior incident: 28.31%
- Population: 181,883
- Driving-related fatalities per 100,000 people (state-wide): 14.8
15. Cheyenne, Wyoming
- Percentage of drivers with a prior incident: 28.65%
- Population: 63,957
- Driving-related fatalities per 100,000 people (state-wide): 21.2
14. Fort Wayne, Indiana
- Percentage of drivers with a prior incident: 28.82%
- Population: 267,633
- Driving-related fatalities per 100,000 people (state-wide): 13.7
13. Gresham, Oregon
- Percentage of drivers with a prior incident: 28.88%
- Population: 110,158
- Driving-related fatalities per 100,000 people (state-wide): 10.5
12. Roseville, California
- Percentage of drivers with a prior incident: 29.01%
- Population: 139,117
- Driving-related fatalities per 100,000 people (state-wide): 9.1
11. Murfreesboro, Tennessee
- Percentage of drivers with a prior incident: 29.43%
- Population: 141,344
- Driving-related fatalities per 100,000 people (state-wide): 15.5
10. Spokane, Washington
- Percentage of drivers with a prior incident: 29.6%
- Population: 219,190
- Driving-related fatalities per 100,000 people (state-wide): 7.6
9. Lincoln, Nebraska
- Percentage of drivers with a prior incident: 30.48%
- Population: 287,401
- Driving-related fatalities per 100,000 people (state-wide): 11.9
8. Des Moines, Iowa
- Percentage of drivers with a prior incident: 30.53%
- Population: 216,853
- Driving-related fatalities per 100,000 people (state-wide): 10.5
7. West Jordan, Utah
- Percentage of drivers with a prior incident: 30.7%
- Population: 116,046
- Driving-related fatalities per 100,000 people (state-wide): 8.8
6. Boise, Idaho
- Percentage of drivers with a prior incident: 30.89%
- Population: 228,790
- Driving-related fatalities per 100,000 people (state-wide): 14.2
5. Madison, Wisconsin
- Percentage of drivers with a prior incident: 30.99%
- Population: 258,054
- Driving-related fatalities per 100,000 people (state-wide): 10.6
4. Canton, Ohio
- Percentage of drivers with a prior incident: 31.27%
- Population: 70,458
- Driving-related fatalities per 100,000 people (state-wide): 10.1
3. Hampton, Virginia
- Percentage of drivers with a prior incident: 32.61%
- Population: 134,313
- Driving-related fatalities per 100,000 people (state-wide): 9.9
2. Greer, South Carolina
- Percentage of drivers with a prior incident: 33.74%
- Population: 32,102
- Driving-related fatalities per 100,000 people (state-wide): 19.7
1. Loveland, Colorado
- Percentage of drivers with a prior incident: 34.43%
- Population: 77,446
- Driving-related fatalities per 100,000 people (state-wide): 11.6
More From Mix 97.9 FM